
Golf Club Fitting
October 8, 2026
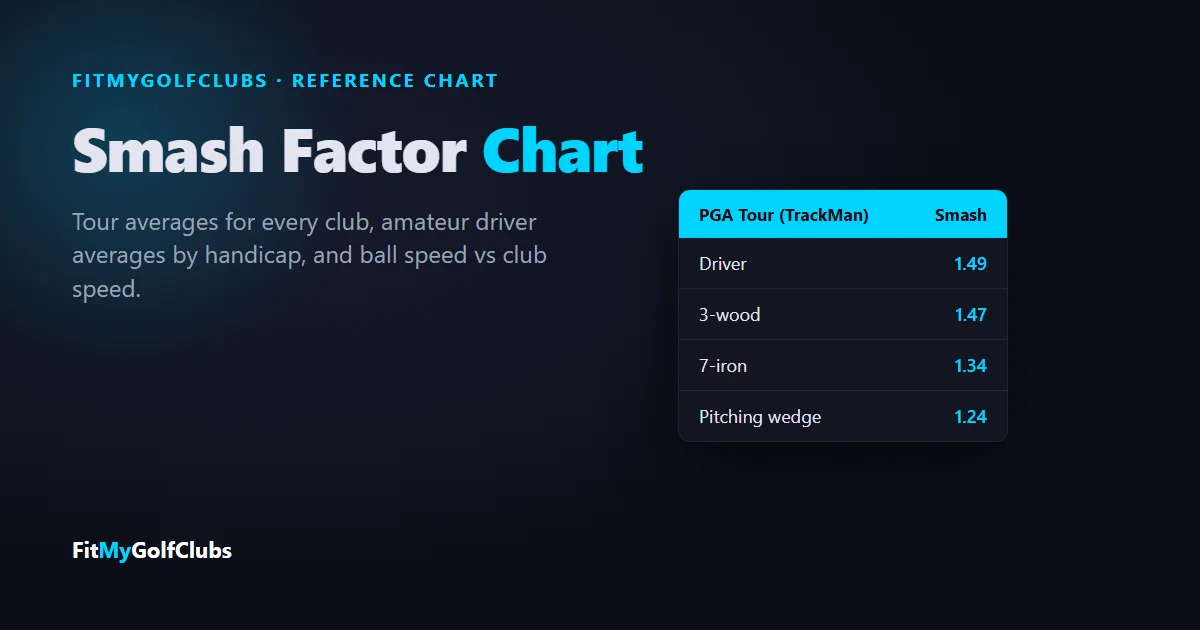
The quick answer: Smash factor is ball speed divided by club speed. TrackMan’s PGA Tour averages run from 1.49 with the driver to 1.34 with a 7-iron and 1.24 with a pitching wedge. TrackMan says a driver smash factor near 1.50 is the goal; its amateur data puts the average golfer at 1.44.
The LPGA Tour averages are almost the same at the top of the bag (1.49 with the driver) and a touch higher from the 5-iron down. The full chart for every club is below, along with TrackMan’s amateur averages by handicap, FlightScope’s tour numbers for comparison, and a table that turns your club speed into the ball speed you should expect.
Smash Factor Chart by Club (PGA and LPGA Tour)
TrackMan’s published tour averages, driver to pitching wedge. TrackMan captured the men’s numbers at 40+ events from 200+ players (mostly PGA TOUR, some DP World Tour) and the women’s at 30+ events from 150+ players (mostly LPGA, some LET).
TrackMan’s LPGA chart has no 3-iron row. The pattern is the one every launch-monitor maker describes: the more loft, the lower the smash factor. FlightScope’s explanation is that more of the energy goes into launch and spin.
What Is Smash Factor?
Smash factor is ball speed divided by club speed, measured at impact. TrackMan describes it as relating “to the amount of energy transferred from the club head to the golf ball.” TrackMan, FlightScope, Foresight and Garmin all define it the same way, so the number on your launch monitor means the same thing whichever one you use.
An example straight from TrackMan: two golfers both swing the driver at 100 mph. One has a smash factor of 1.40 and a ball speed of 140 mph; the other has 1.50 and 150 mph. TrackMan says that 10 mph of ball speed “equates to approximately 20 yards in distance” — with the same swing speed.
Club Speed, Ball Speed and Smash Factor on Tour
The full TrackMan rows, so you can see where each smash factor comes from:
PGA Tour (TrackMan)
LPGA Tour (TrackMan)
TrackMan prints the speeds to the whole mph, so dividing them yourself can land a few hundredths off the smash factor in the chart (the LPGA wedge row is the biggest: 88 ÷ 72 is 1.22, against TrackMan’s printed 1.25). We show the smash factors as TrackMan prints them.
What Is a Good Smash Factor for Amateurs?
TrackMan publishes driver smash factor averages from its Combine data, by handicap:
So for the driver, the average male golfer (a 14.5 handicap) sits at 1.44, a bogey golfer at 1.43, and scratch golfers match the tour at 1.49. A driver smash factor of 1.45 is in line with 5- and 10-handicap men. TrackMan, FlightScope and Foresight all name about 1.50 as the target with a driver. TrackMan doesn’t publish amateur averages for the other clubs.
⛳ Know your club speed? Make sure your clubs fit it.
Smash factor tells you how well you hit it; the right length, loft and shaft make center contact easier to repeat. Our free bag grade checks every club in your bag from your specs, with no launch monitor needed to start, and it works with your launch monitor numbers when you have them. Not sure your shaft matches your speed? Try our Shaft Flex Calculator. Grade my bag free →
Ball Speed vs Club Speed Chart (Driver)
This table is computed: club speed × smash factor, rounded to the mph. The smash factors are TrackMan’s (bogey golfer, average golfer and the PGA Tour average) plus the 1.50 target. Read it either way: find your club speed to see the ball speed you should expect, or find your ball speed to see how efficient your strike is.
If your launch monitor shows 100 mph of club speed and 144 mph of ball speed, you’re at the average golfer’s 1.44. Pushing that to 1.48 or 1.49 adds 4–5 mph of ball speed without swinging any faster. To see how your driver speed lines up with distance and shaft flex, see our golf club distance chart and swing speed and shaft flex chart.
Converting Ball Speed to Club Speed
Some launch monitors show ball speed but not club speed. Divide ball speed by smash factor to get back to club speed — also computed, from the same TrackMan driver smash factors:
Once you have your driver club speed, our swing speed and shaft flex chart turns it into a flex.
Ball Speed vs Club Speed: 7-Iron and Pitching Wedge
Also computed, from TrackMan’s PGA and LPGA Tour smash factors for these clubs. Tour players are the only published benchmark for irons, so treat these as the top of the range:
TrackMan vs FlightScope Tour Averages
FlightScope publishes its own tour-averages chart on its smash factor page, and the two don’t agree exactly. For the PGA Tour, FlightScope’s numbers are a little higher all the way down — 1.37 against TrackMan’s 1.34 with a 7-iron, 1.27 against 1.24 with the wedge. For the LPGA Tour, FlightScope’s irons are mostly a touch lower. The two charts come from different data sets and FlightScope’s isn’t dated, so we use TrackMan’s as the main chart and show both here:
FlightScope’s LPGA chart has a 3-iron and no hybrid; TrackMan’s has a hybrid and no 3-iron. FlightScope notes that altitude and conditions weren’t accounted for in its data.
What Is the Maximum Smash Factor?
TrackMan, FlightScope and Foresight all name about 1.50 as the target with a driver; Foresight calls 1.5 “the gold standard” of smash factor. FlightScope explains that the highest achievable smash factor for any club “is dependent on the mass of the club and ball, and the spin loft of the club at impact” — and every maker notes that more loft means a lower smash factor. And higher isn’t always better: TrackMan Master Andrew Rice points out that “it is also possible to have a Smash Factor that is too high with certain clubs.”
How to Improve Your Smash Factor
- Hit the center of the face. FlightScope: “Increasing your smash factor comes down to one key thing: centered contact.” Foresight lists centeredness of contact first too.
- Try FlightScope’s gate drill. Push two tees into the ground, one each side of the ball, to make a narrow gate for the clubhead, and hit the ball without touching either tee.
- Check your face to path and attack angle. TrackMan Master James Leitz looks at face to path, spin loft and impact location when smash factor is low. Foresight adds that a too-steep attack angle with the driver costs energy transfer.
- Check the fit. TrackMan Master Richard Woodhouse: if attack angle, dynamic loft, face to path and impact location are good, “I will definitely question if the equipment is the correct fit.”
Our own general advice, not a launch-monitor maker’s: impact tape or a dusting of foot spray on the face shows you where you’re striking it, and a club that’s too long for you makes the center of the face harder to find. Change one thing at a time and watch the number.
Frequently asked questions
What is smash factor and how is it calculated?
Smash factor is ball speed divided by club speed at impact. A 100 mph club speed that produces 150 mph of ball speed is a smash factor of 1.50. TrackMan, FlightScope, Foresight and Garmin all calculate it the same way.
What is a good smash factor for a driver?
TrackMan, FlightScope and Foresight all put the target at about 1.50. TrackMan's PGA and LPGA Tour averages are 1.49, and its amateur data puts the average male golfer at 1.44 and a bogey golfer at 1.43.
Is 1.45 a good smash factor?
With a driver, yes. TrackMan's Combine data has 5- and 10-handicap men averaging 1.45, above the average golfer's 1.44. With a 7-iron, 1.45 would be higher than any tour average TrackMan or FlightScope publishes.
Is a 1.40 smash factor good?
With a driver it's below TrackMan's bogey-golfer average of 1.43, so there's ball speed to gain. With a 6-iron it's right at tour level: TrackMan's PGA Tour average is 1.39 and its LPGA average 1.41.
What is the average smash factor for a 6-iron?
TrackMan's tour averages are 1.39 on the PGA Tour and 1.41 on the LPGA Tour. FlightScope's chart has 1.42 and 1.39.
What is a good smash factor for a 7-iron?
TrackMan's tour averages are 1.34 (PGA Tour) and 1.38 (LPGA Tour). FlightScope's chart shows 1.37 for both.
Why is my wedge smash factor lower than my driver?
Loft. Garmin puts it simply: "Increased club loft decreases smash factor." TrackMan says a pitching wedge should be near 1.25, and its tour averages are 1.24 (PGA) and 1.25 (LPGA).
Sources: TrackMan’s PGA and LPGA Tour Averages (2023 data, published May 2, 2024) and What is Smash Factor? (including TrackMan Combine averages); FlightScope’s Optimizing Smash Factor in Golf and its tour-averages chart; Foresight Sports’ What is Smash Factor?; Garmin’s swing metric definitions. All checked October 9, 2026. Ball-speed tables computed by FitMyGolfClubs from those smash factors.
Related reading
- Golf Club Fitting Chart — Length and lie by height, flex by swing speed, and every chart we publish.
- Swing Speed and Shaft Flex Chart — Which flex fits your driver speed.
- Golf Club Distance Chart — How far you should hit every club, by swing speed, skill and age.
- How to Test Golf Clubs With Launch Monitors — Which numbers to watch when you test clubs on a launch monitor.
- Golf Ball Compression Chart — Compression for every major ball, matched to swing speed.
- Wedge Distance Chart — Pitching, gap, sand and lob wedge yardages, plus wedge loft gapping.
- Golf Driver Fitting — What a driver fitting checks, what it costs, and who benefits.
- 7 Iron Swing Speed Chart — Iron shaft weight by 7-iron speed, tour 7-iron averages, and 7-iron carry by speed.
Related Articles
Golf Club Fitting
October 8, 2026
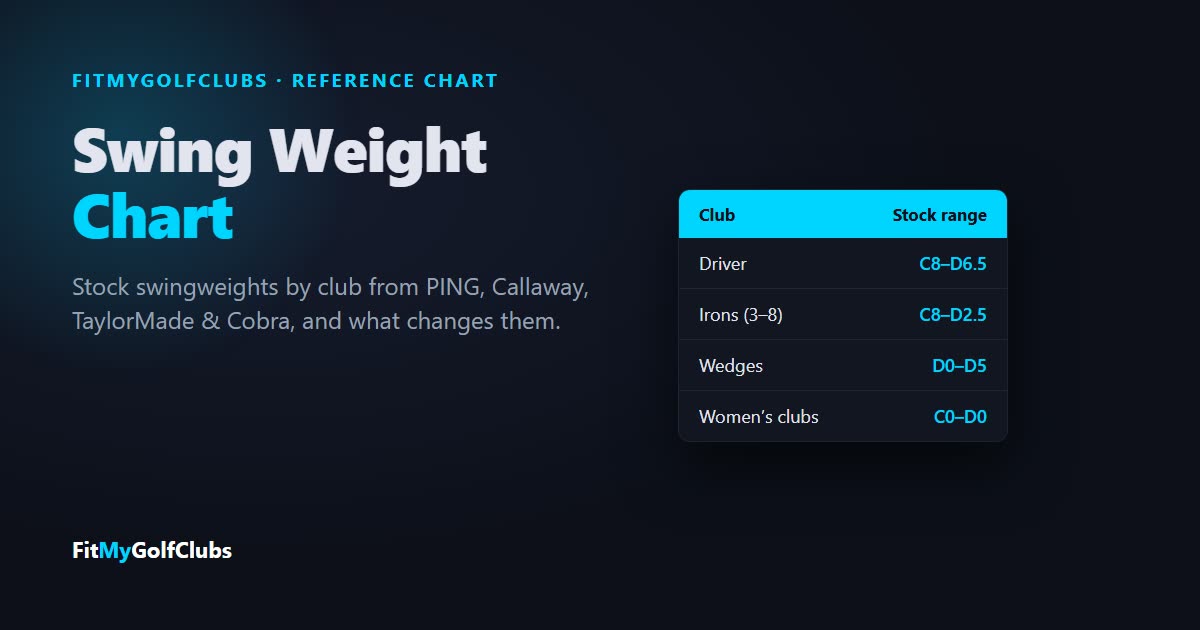
Swing Weight Chart: Standard Swingweights by Club and Brand
Swing weight chart: the A0–G9 scale, stock swingweights for drivers, irons and wedges from PING, Callaway, TaylorMade and Cobra, and what changes them.
Golf Club Fitting
October 8, 2026
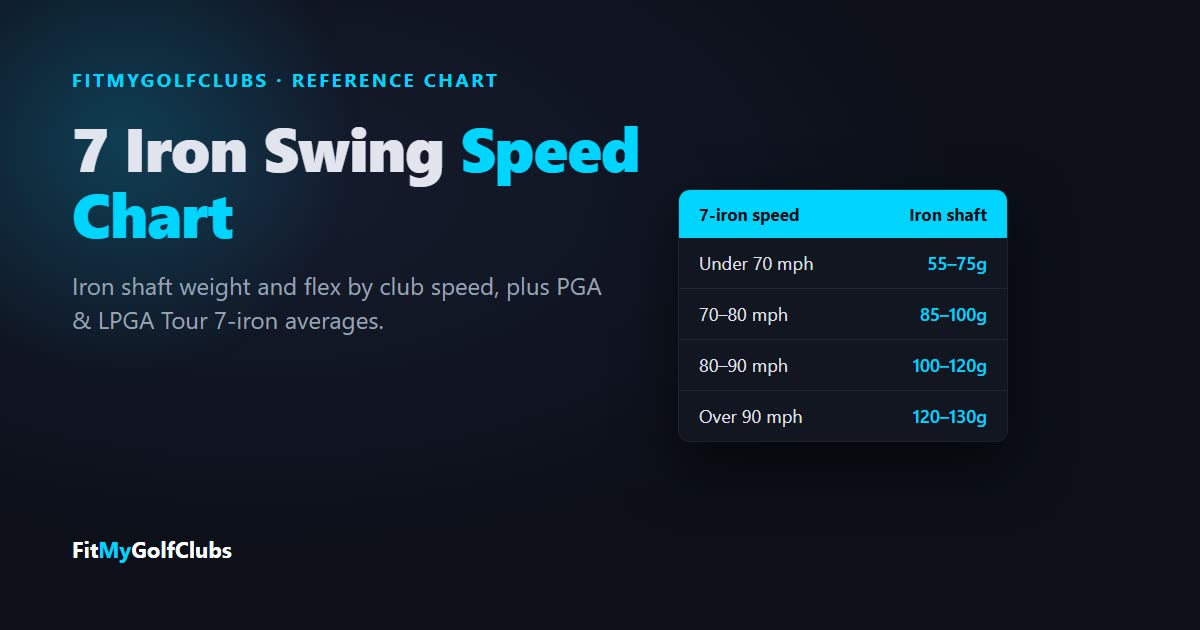
7 Iron Swing Speed Chart: Iron Shaft Weight, Flex & Carry
7 iron swing speed chart: iron shaft weight and flex by club speed, PGA (92 mph) and LPGA (78 mph) Tour averages, and 7-iron carry by speed.
Golf Club Fitting
October 8, 2026
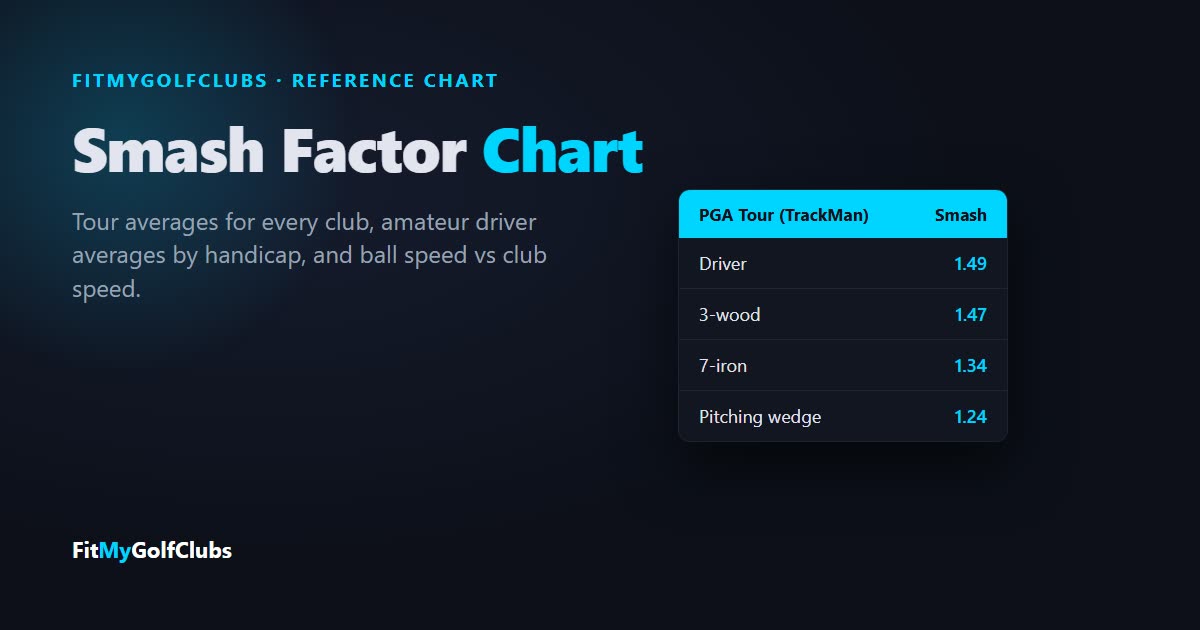
Smash Factor Chart: Tour Averages by Club + Ball Speed
Smash factor chart by club from TrackMan PGA and LPGA Tour averages, amateur driver averages by handicap, and a club speed to ball speed table.


© 2026 FitMyGolfClubs. All rights reserved. | Patent Pending
Contact: sean@fitmygolfclubs.com